FBI Database Shows Colma Police Officer Ratio Highest In Bay Area
COLMA (CBS SF) -- The town of Colma, home to 1,593 residents and 1,000 times more deceased residents of the many cemeteries there, has 12 police officers – the largest ratio of any Bay Area city.
Last year there were no murders, rapes or arsons in the 2.2 square miles of the city.
"The town of Colma is very fortunate to have very low violence and I'd have to give kudos to the police department for providing the quality of service to town residents," said Colma Police Commander Kirk Stratton.
Colma's police officer coverage works out to 9.3 officers for every 1,000 residents, three times as much as the next city on the Bay Area list, Belvedere, according to the FBI's Uniform Crime Reporting Program.
Stratton said the 30-thousand visitors daily to Colma's variety of businesses in Colma requires a higher rate of police coverage, which he says works out to about the national average using that criteria.
"We have Metro Mall, Serra Shopping Center, Auto Row, we have Lucky Chances card club as well," said Stratton.
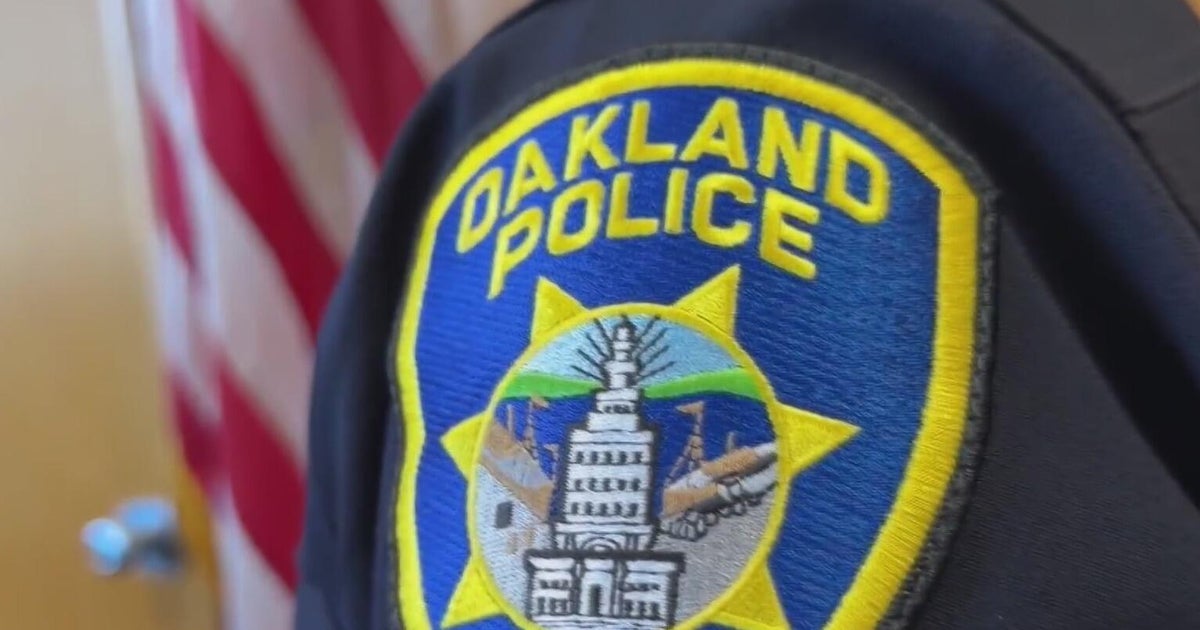
San Francisco came in fourth place with 2.6 officers per 1,000 citizens, and Oakland in 12th with about 1.6 officers per 1,000 residents.
Antioch, Vallejo, and Hercules join several other cities, coming in last with fewer than one officer for every 1,000 residents.
| CITY NAME | POPULATION | OFFICERS | PER 1,000 |
| Colma | 1,832 | 17 | 9.3 |
| Belvedere | 2,109 | 8 | 3.8 |
| Emeryville | 10,309 | 34 | 3.3 |
| San Francisco | 820,363 | 2,173 | 2.6 |
| Brisbane | 4,374 | 11 | 2.5 |
| Kensington | 5,185 | 10 | 1.9 |
| St. Helena | 5,939 | 11 | 1.9 |
| El Cerrito | 24,156 | 41 | 1.7 |
| Piedmont | 10,909 | 19 | 1.7 |
| Richmond | 106,357 | 182 | 1.7 |
| San Pablo | 29,884 | 50 | 1.7 |
| Oakland | 399487 | 626 | 1.6 |
| Berkeley | 114,961 | 171 | 1.5 |
| Mill Valley | 14,181 | 21 | 1.5 |
| Menlo Park | 32,713 | 47 | 1.4 |
| Pinole | 18,864 | 27 | 1.4 |
| Sunnyvale | 143,606 | 201 | 1.4 |
| Tiburon | 9,142 | 13 | 1.4 |
| Albany | 18,960 | 25 | 1.3 |
| Los Gatos | 30,161 | 39 | 1.3 |
| San Anselmo | 12,584 | 16 | 1.3 |
| Watsonville | 52,064 | 66 | 1.3 |
| Concord | 125,205 | 144 | 1.2 |
| Hayward | 147,424 | 179 | 1.2 |
| Milpitas | 68,433 | 79 | 1.2 |
| South San Francisco | 65,006 | 81 | 1.2 |
| Alameda | 75,467 | 81 | 1.1 |
| Belmont | 26,389 | 28 | 1.1 |
| East Palo Alto | 28,766 | 33 | 1.1 |
| Fairfield | 107,110 | 117 | 1.1 |
| Petaluma | 58,995 | 62 | 1.1 |
| Pleasanton | 71,875 | 81 | 1.1 |
| San Bruno | 42,002 | 45 | 1.1 |
| San Jose | 976,459 | 1,094 | 1.1 |
| Santa Clara | 119,360 | 137 | 1.1 |
| Stockton | 299,105 | 331 | 1.1 |
| Daly City | 103,311 | 106 | 1 |
| Livermore | 82,800 | 82 | 1 |
| Los Altos | 29,704 | 30 | 1 |
| Merced | 80,976 | 83 | 1 |
| Pittsburg | 64,890 | 67 | 1 |
| San Mateo | 99,303 | 103 | 1 |
| San Rafael | 58,854 | 58 | 1 |
| Colton | 53,431 | 46 | 0.9 |
| Martinez | 36,729 | 34 | 0.9 |
| Napa | 78,589 | 67 | 0.9 |
| Pacifica | 38,041 | 33 | 0.9 |
| Vacaville | 93,951 | 89 | 0.9 |
| Antioch | 105,009 | 86 | 0.8 |
| Hercules | 24,682 | 19 | 0.8 |
| San Ramon | 74,013 | 57 | 0.8 |
| Vallejo | 117,912 | 92 | 0.8 |
| Moraga | 16,401 | 12 | 0.7 |
| Suisun City | 28,593 | 21 | 0.7 |
You can download the complete list of full-time Bay Area officers by city here.