By The Numbers: The Total Average Concept
By Father Gabe Costa
» More Columns
Mr. Mathieu Philie is By The Numbers' guest blogger this week. As a student of sabermetrics, he takes a statistical and technological "modern look" at a metric which appeared in the Baseball Research Journal (a publication of the Society for American Baseball Research) in 1987. The original article was written by Mr. Richard M. Cochrane and was titled: "The Total Average Concept: Hitting, Pitching, Team Play."
For New York Yankees fans, any season that does not end with a World Series championship is a disappointment. However, Baltimore Orioles fans were excited to see their team make the postseason in 2012 for the first time since 1997. How did they do it? Was it more home runs, better all-around batting, better pitching? What was different about the 2012 Orioles that lifted them to the postseason? We will dive into sabermetrics and the weighted team total average (TTAw) concept to figure out why.
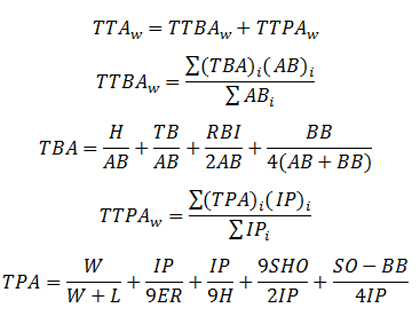
As seen in the equations below, TTAw is defined by the sum of weighted team total batting average (TTBAw) and weighted team total pitching average (TTPAw). The two component metrics, TTBAw and TTPAw , are both defined below (note that SHO stands for Shutouts; all other abbreviations are pretty much standard). The higher the TTAw the better, and the best teams in history have a TTAw greater than two.
We will look into the Orioles' statistical history from 1996 to 2012 (they made the postseason in 1996 as well) to highlight any relationships between good and bad seasons, which we will measure with wins. The statistics for these seasons are given in the table below.
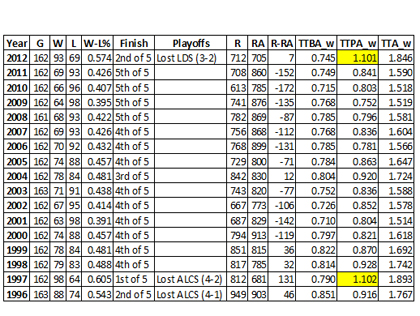
Using a rough analysis of the raw data, the coefficient of determination (R2) between wins and run differential is .790. This is a decent R2 value, but the relationship does not give us any insight into the many factors that contribute to runs and runs allowed. The chart below illustrates the relationships of wins against TTBAw, TTPAw and TTAw.
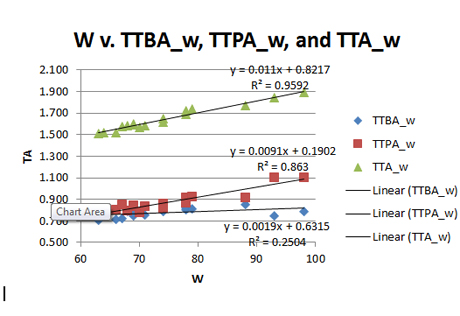
TTAw has an astounding .959 R2 value, and TTPAw has a very good R2 value of .863. TTBAw has no statistical correlation with wins over the course of these Orioles seasons. Furthermore, better pitching for the Orioles in 2012 pushed them to the postseason.
In 2012, the Orioles had good pitching for a couple of reasons. First of all, they had a deep bullpen. Of 13 pitchers who had 50 or more innings pitching, 10 of them had a TTPAw greater than one. Similarly, the 1997 Orioles had eight out of 11. Compare that to only 11 pitchers who had 50 or more innings pitched and a TTPAw greater than one from 2006 to 2011 combined. Secondly, the 2012 Orioles had a great closer in Jim Johnson. His 51 saves ranked ninth all-time. Likewise, Randy Myers of the 1997 Orioles had a healthy 45 saves. No other Orioles closer from 1996 to 2011 was close to these marks.
Another well-known fact by any MLB fan is that the 2012 Orioles had a shattering 29-9 record in one-run games. This .763 W-L pecentage was the best out of any MLB team from 1901 to 2012. One-run wins can be attributed to many different factors occurring throughout the game. However, when using TTAw to analyze the 2012 Orioles and the three-next best one-run win teams, there are some more intriguing insights as seen in the table below. Note that RS = Runs Scored, RA = Runs Allowed and pythW-L percentage is the so-called Pythagorean Record Prediction.
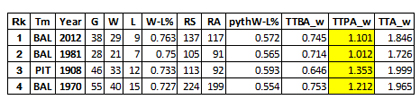
Great one-run win teams have great pitching throughout the year based on all four of the teams having a TTPAw greater than one. TTBAw numbers for these teams again point to no significance. The 2012 Orioles' one-run wins were definitely a difference-maker for making it into the postseason. Great pitching was a factor for both their full regular season and one-run win success.
If I was in the Orioles' front office for 2013, I would focus on maintaining a great bullpen in order to reach the postseason again and push closer to a World Series championship. All the hype of batting statistics does not answer the question of Orioles success according to the TTAw concept of sabermetrics.
The numbers never lie.
Offer your thoughts in the comments section below...