CBS News Battleground Tracker: How the delegate estimates work
On a summer day in Milwaukee, the Democratic Party will select its 2020 nominee for president. You can imagine the scene: The candidate emerging on stage to thunderous applause, a rousing speech, and at some point, a deluge of balloons.
Getting there is all about delegates, those cheering party leaders and state officials who technically make that person the nominee. Primaries and caucuses, on the other hand, are about voters like you.
So just how do the voters' preferences translate into delegates at the convention? The CBS News Battleground Tracker aims to explain that and enables you to view the nomination process the way the campaigns do.
How does the Democratic Party award delegates?
In state primaries and caucuses, candidates are awarded delegates, who are then pledged to support them at the convention.
This year, there are an estimated 3,768 delegates up for grabs. A candidate needs 1,885 — a simple majority — to secure the nomination. (This is based on the latest information we have from the party.)
Delegates are split among the top vote getters. It's not winner-take-all. This may be especially important this year, with such a large field of candidates. Candidates who finish second, third, and fourth in a state can still earn delegates there.
Delegates are also divvied up among the top vote getters in each sub-region of the state, usually defined by congressional district. Each district's delegates are awarded to candidates based on how they do in that district.
The logic is that it forces candidates to build support all over the state — in cities, suburbs, and rural areas — in areas that may otherwise be under-represented.
Which candidates are considered "top vote getters," according to party rules? Delegates are only allocated to candidates who win more than 15% of the vote. Any candidate below this threshold — even by a slim margin — doesn't get any delegates in that state or district. That cutoff has a lot of importance, as there is a very thin line between walking off with something or nothing.
For candidates above the threshold, delegates are awarded proportionally by their vote percentage. So candidates with more votes get more delegates, as long as they are above that magic 15% number.
What does the CBS News Battleground Tracker capture?
The goals of the CBS News Battleground Tracker are to explain what's on voters' minds and to show how vote preferences break down in terms of delegates.
Our first challenge is to estimate each candidate's support in each district. Traditional state polls are not usually precise enough to break down results by district.
The good news is that we have additional information: We know which candidates different types of voters are supporting (from our polling); we know how many of them are in each district (from voter files); and we know a lot about the district as a whole, like its demographic profile and voting history.
We can combine all that information to get more precise estimates.
We use a statistical tool called multilevel regression and post-stratification (MRP) to estimate district-level opinion. We collaborate on this with Professor Doug Rivers and Delia Bailey at YouGov, building on their work on U.K. elections, as well as the CBS News/YouGov U.S. House Model, which used a similar technique to estimate results for 435 House seats in the 2018 midterms.
How does the Battleground Tracker translate voter preferences into delegate estimates?
Step 1: Talk to many people — many more than in a typical poll — so we can connect voting preferences with specific voter types in a detailed and robust way. We survey thousands of registered voters, and the most important questions we ask for estimation purposes are:
How likely they are to vote in their state's Democratic primary or caucus;
Which candidates they are currently considering (they can pick as many as they want);
Which candidate they would vote for today among those they are considering.
Step 2: Figure out how people's vote intentions are related to key characteristics, including age, gender, race, education, past votes and where they live.
Each voter has a "profile."
For example, one profile may be a 56-year-old, white male, who didn't graduate college and lives in California's 5th congressional district. Change any one of these individual characteristics and you'll get a different profile. For every profile, we look at our 2020 polling data and calculate how many voters of that specific profile intend to vote for each Democratic candidate.
A nice feature of MRP is that it efficiently combines information about similar types of voters who live in different places. This is really helpful in districts where our poll reached fewer people, because opinions rarely stop at district or even state boundaries, especially since our politics has become so nationalized.
When we know a lot about any given type of voter, we can improve our estimate of that subgroup in any particular district. If we know that middle-aged, non-college males across the early primary states are backing a particular candidate, we use this information to inform our estimate of middle-age, non-college males in California's 5th district.
Step 3: Estimate how many people of each voter profile live in each district. For this we use a combination of U.S. Census data and voter files, which includes counts of voters at very granular levels, such as voting precincts. Our model also adds local factors, such as district and state effects.
These steps allow us to estimate each candidate's vote share in each district. We multiply the number of people of a given profile by the proportion of voters with that profile choosing the candidate. Aggregating across all voter profiles in a district, we finally get the estimate of the candidate's vote share there. Aggregating districts gives us a statewide estimate.
Once we've estimated each candidate's vote share in each state and district, we have the information to translate their current support into delegate breakdowns. We allocate the available delegates based on their estimated vote shares, according to the party rules we described above.
The graphic below shows what could hypothetically happen if different candidates were to win different districts in a state -- in this case, South Carolina.
Candidate A is leading in the state with 25 delegates overall, driven by their lead in congressional districts 5, 6 and 7.
Candidate B isn't far behind, doing particularly well in districts 1, 2 and 4.
Candidate C is also on the board, leading in district 3.
Each step in this process includes statistical uncertainty, which we incorporate into our estimates. In a final step, we simulate the vote in each district 1,000 times. "Simulate" is a statistical term (as in Markov chain Monte Carlo simulation). The idea is to let the variation in the data we collected tell us about the precision of our estimates. The simulation is a process of accounting for all reasonable possibilities that could result from the data we collected.
In other words, if the data consistently points to the same thing time after time, there is less uncertainty around our estimates. But if the data shows a wide range of possibilities, that results in a wider range of results in the simulation and greater uncertainty.
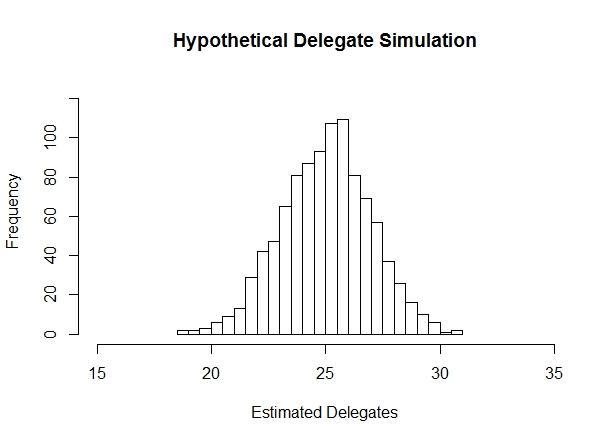
Here's an example of what the simulations look like. We report delegate estimates using the average simulation, and the range of results gives us a sense of what's possible. We report a 95% confidence interval, by using the range between the 2.5th percentile and 97.5th percentile of simulations. This is similar to the margin of error you may be used to seeing in conventional poll results.
If a candidate's estimate is right around the 15% threshold, they may cross it in some simulations and fall short in others. Our simulation provides a ceiling and a floor for each candidate's possible delegate count.
There are a couple of important caveats about this method. First, we are estimating how the race stands now, with the expectation that things will change. Over the course of the campaign, voters will become more familiar with candidates and perhaps change their minds.
Importantly, this is a snapshot based on the data. It is not a simulation of the future. There's nothing here accounting for forward-looking uncertainty — nothing about the chances that a candidate makes a gaffe or has a great debate next week or what have you, or just that the voters change their mind.
Second, we are estimating which voters are likely to vote in their state's primary or caucus based on what they tell us they'll do, as well as recent historical patterns (this is known as a likely voter model). We estimate the proportion of voters of each profile who will turn out using a similar model based on individual-, district-, and state-level variables.

