A favorite Warren Buffett stock market metric is at all-time high
Without question, Warren Buffett and the rest of Berkshire Hathaway's investment team incorporate many different metrics when evaluating prospective companies to acquire and stocks to buy. However, Buffett himself has mentioned one specific metric as the best indicator of stock valuations, and it has appropriately been nicknamed the "Buffett Indicator" in the investing community. Here's what the Buffett Indicator is, and why it may be signaling that the stock market is a bit overheated.
The Buffett Indicator
This is a metric that Buffett uses to get an overall feel for the valuation of U.S. stocks. In fact, he described it as "the best single measure of where valuations stand at any given moment" in a 2001 interview with Fortune Magazine.
It's a fairly simple metric to calculate, too. Just divide the total market capitalization of all U.S. stocks by the latest gross domestic product, or GDP.
Is it reliable?
To be clear, no stock market metrics are 100% reliable at predicting corrections, crashes, rallies, or stagnant stock markets. After all, if this were the case, wouldn't everyone know exactly when to buy, sell, and hold in order to maximize their profits?
That being said, the Buffett Indicator, while it's not a flawless indicator, does tend to peak during hot stock markets and bottom during weak markets. And as a general rule, if the indicator falls below 80%-90% or so, it has historically signaled that stocks are cheap. On the other hand, levels significantly higher than 100% can indicate stocks are expensive.
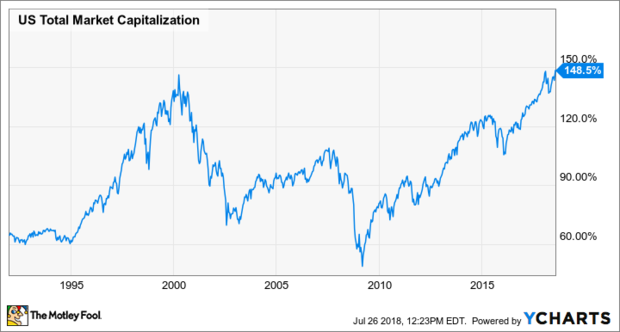
For context, the Buffett indicator peaked at about 145% right before the dot-com bubble burst and reached nearly 110% before the financial crisis.
There are two big caveats to realize. First, just because the Buffett Indicator signals that stocks are cheap doesn't mean that they won't get even cheaper. As you'll see in the chart in the next section, the Buffett Indicator didn't bottom out during the financial crisis until it was briefly below 50%. Conversely, just because the Buffett Indicator looks expensive (like it does now) doesn't mean that stocks can't continue to muscle higher.
In a nutshell, the Buffett indicator can tell you the valuation of the stock market in a historical context right now. It doesn't predict tops or bottoms.
What's the Buffett Indicator saying now?
Where does the Buffett Indicator stand now? It may surprise you to learn that, at nearly 149%, the total market cap to GDP ratio has never been higher. It's even higher than the 145% peak we saw during the dot-com bubble.
There are some good reasons for high valuations, such as the new, lower corporate tax rate, the generally business-friendly administration, a prolonged period of historically low interest rates, low unemployment, high consumer confidence, and soaring corporate earnings, just to name a few. I'd even go so far as to say that the fact that the Buffett Indicator doesn't take some of these things into account is perhaps its biggest flaw. For example, if you look at the stock market during a high-interest period and a low-interest period, examining stock valuations isn't exactly an apples-to-apples comparison.
Having said that, it does seem like Buffett himself is paying attention and agrees that the market is generally expensive. After all, the lack of attractive investment opportunities has resulted in Berkshire Hathaway accumulating nearly $110 billion of cash and equivalents on its balance sheet. Plus, Buffett has specifically cited valuation when discussing the absence of major acquisitions lately.
Should investors worry?
To sum it up, while the Buffett Indicator is certainly a great snapshot of stock valuations, it's not a stand-alone metric that you should use to determine when to buy or sell. When asked about the Buffett Indicator and another favorite metric at Berkshire's 2017 annual meeting, Buffett said that, "It's just not quite as simple as having one or two formulas and then saying the market is undervalued or overvalued."
With that in mind, the fact is that the Buffett Indicator is at its highest point in history -- meaning that stocks have never been valued as high as they are now in terms of market cap to GDP. While this indicator doesn't necessarily mean that the tides will turn anytime in the near future, it may be a smart idea to start thinking a little defensively.
This article originally appeared on the investing website Motley Fool.


