The 5 best and worst states for drivers
If you want to have the best driving experience, live in a state with plenty of open road.
That seems to be the message from a new ranking by personal finance website Bankrate.com of the best and worst states for drivers.
Analyst Chris Kahn used cost of driving, safety and overall driving experience to rank the states. Measurements included the cost of gas, insurance and repairs as well as the rate of auto thefts and fatal crashes and the average time spent commuting.
Commute times and auto theft rates especially worked against states with dense urban areas. For instance, average weekly commuting time in Idaho is 3.25 hours, compared with 4.5 in California.
"The best states for drivers have lots of wide-open spaces whereas the worst states tend to be filled with people and cars -- a bad combination for driver's wallets," Kahn said.
You can't do much about gas or insurance costs. But weekly commuting time might be different.
"See if you can arrange to work at home part of the time," Kahn advises. "You'll be saving time, money and hassle."
Read on to see which states are best -- and worst -- for drivers.
Best: Idaho
In addition to relatively short commuting times, Idaho offer low insurance costs, at an average $656 per year. The $733 motorists spend on gas annually is lower than the national average of $911, while repair costs, at $379 per year, are also low.
It also is a relatively safe place for your car, with 95 thefts per 100,000 people versus a nationwide average of 221. In terms of fatal crashes, however, Idaho is more dangerous -- 1.34 per 100 million miles driven, versus the average of 1.11. That presumably involves driving at high speeds through those big, empty spaces.
Best: Vermont
Not as big as Idaho but nearly as rural, Vermont compares favorably in terms of insurance costs -- $722 per year versus a national average of $911.
It also ranks very well in safety, with only 53 thefts per 100,000 people, compared with a national average of 221. The average rate of fatal crashes, at 0.97 per 100 million miles driven, is also lower than the national average.
Best: Wyoming
Commuting time in Wyoming, with a population of 583,000, is a breeze compared with most other parts of the U.S. Motorists in the state spend only 2.65 hours a week, versus a national average of four hours. But driving those long distances adds up to higher gas expenditures per year, at $1,614, compared with a $919 nationwide.
Wyoming ranks well in terms of crime and safety. The theft rate is 99 per 100,000 people, while the national average is 221. The rate of fatal crashes is 0.94 per 100 million miles driven, versus 1.11 nationally.
Best: Wisconsin
Wisconsin is more populous than the three states ahead of it, with a a population of 5.7 million. But despite the big-city driving in Milwaukee, the state-wide commuting time of 3.6 hours per work week is somewhat better than the national average of four hours.
The state's annual insurance cost of $796 beats the national average of $911. On the crime front, it registers 99 thefts per 100,000 population, versus 220 nationwide. And the fatality rate also is better than average -- 0.94 per 100 million miles driven compared with the nationwide figure of 1.11 deadly crashes.
Best: Minnesota
Minnesota, with more than 5 million people, has a slightly better than average commuting time of 3.75 hours per week. Its annual gas expenditure of $782 beats the national average of $911. It really excels as measured by the number of fatal crashes per 100 million miles -- 0.68 versus a national average of 1.11. Auto thefts are 147 per million miles driven compared with 221 for the U.S. as a whole.
Worst: Louisiana
Louisiana ranks 50th -- that's last for anyone experience -- in terms of overall driving costs and experience, according to Bankrate.com.
Bankrate analyst Chris Kahn said he was initially puzzled by this result since Louisiana, with a population of 4.6 million, has lots of rural areas. But the average commuting time, perhaps bolstered by New Orleans traffic jams -- is near the national average of four hours weekly.
The annual insurance cost in the state is notably high -- $1,279 versus a national average of $910. That is likely tied to the very high fatal accident rate, at 1.51 per 100 million miles driven compared with a 1.11 nationwide average.
Worst: California
No one, least of all Californians, will be surprised that the state has among the worst driving experiences.
More than 38 million people are crammed into the car-crazy Golden State. And a lot of those people are stealing cars. The rate of 431 thefts per 100,000 people is nearly twice the national average.
Surprisingly, the average commute time is only slightly worse than the national average, at 4.4 hours per week. Another surprise is that the average insurance cost per year -- $894 -- is slightly below the national average of $911. Clearly, the very high theft rate has pushed down California's score in these ratings.
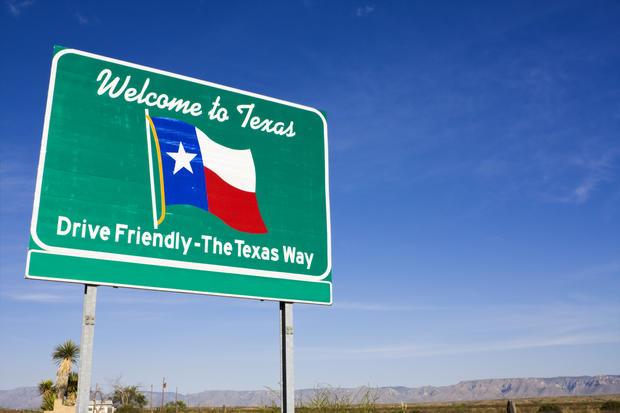
Worst: Texas
Texas is the second-most populous state in the U.S., with 26.5 million people, and it has the third-worst driving experience.
If everything really is bigger in Texas, that includes the gas bills -- $1,013 per year versus a national of average $910. Insurance also is costly, with an average annual premium of $1,037, versus $949 nationwide.
Auto thefts are slightly above average at 248 per 100,000 people, versus a national average of 220. Likewise, the fatal accident rate of 1.42 per 100 million miles driven tops the average of 1.11 for the U.S. as a whole.
Worst: Maryland
Maryland can blame Washington, D.C. for its low ranking. Adjacent to the national capital and with many of its 5.9 million residents commuting to work at at federal agencies, Maryland has the worst commuting time in the U.S. -- six hours weekly, or double national average.
That squares with another recent ranking that found the Washington, D.C., metro area the worst in the nation for overall traffic. Both annual gas costs, at $1,035, and insurance premiums ($1 ,071) are above average. Auto thefts are just above average and fatalities, at 0.83 per million miles driven, is below the national number of 1.11.
Worst: New Jersey
As with California, it's no surprise to find New Jersey on the list of worst driving experiences. (Its neighbor, New York, with an equally bad traffic image, ranks eighth worst.).
New Jersey has a worse than average commuting time -- 4.6 hours weekly versus a national average of four hours. That traffic tangle drags down New Jersey's rating. And both gas expenditures, at $1,266 a year, and insurance ($1,335) are above average. Auto thefts -- at 154 per 100,000 people and fatal crashes at 0.74 per 100 million miles driven -- are below average.


