Five days to go: The presidential race tightens - CBS/NYT poll
By Sarah Dutton, Jennifer De Pinto, Fred Backus, Kabir Khanna and Anthony Salvanto
Where the Race Stands
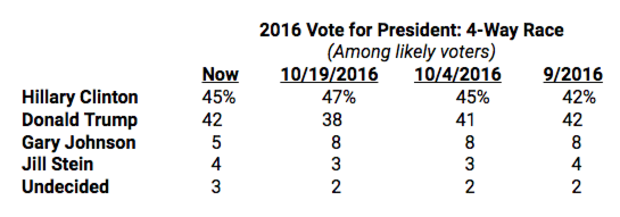
The race for president has tightened since mid-October: Hillary Clinton now leads Donald Trump by three points nationally. Just over two weeks ago, after the second debate and amid accusations by women that Trump had made unwanted sexual advances towards them, Clinton’s lead had expanded to 9 points, up from her 4 point lead in early October.
In a two-way match-up (without explicitly naming third party candidates), Clinton’s margin is similar: she leads Trump by 3 points among leaned likely voters, down from an 11 point lead a couple of weeks ago.
At this late date, few voters say they might change their minds.
Recent Controversies
As the FBI begins to sift through emails belonging to a top aide of Hillary Clinton, 62 percent of likely voters who have yet to go to the polls say the recently discovered emails and the FBI’s actions don’t make a difference to their vote, though about a third say it makes them less likely to cast their vote for Clinton. Most Republicans say the FBI’s actions make them less likely to vote for Clinton, while most Democrats and independents say it makes no difference.
Eight in 10 registered voters have heard something about the latest development in the Clinton email controversy, including nearly half who have heard a lot about it.
The allegations of unwanted sexual advances brought by a number of women against Donald Trump are also familiar to registered voters – most have heard or read a lot about these allegations. Still, six in 10 likely voters who have yet to cast their ballot say the allegations don’t make a difference in their vote, though four in 10 say they make them less likely to vote for him. Most Democrats (60 percent) are less likely to vote for Trump because of these allegations, while most Republicans (81 percent) and independents (59 percent) say the allegations make no difference.
Voter Enthusiasm
Majorities of each candidate’s supporters say they are at least somewhat enthusiastic about voting this year – but slightly more Trump voters than Clinton voters are very enthused.
Nevertheless, at 49 percent of likely voters overall, enthusiasm lags behind the excitement voters felt prior to the 2012 presidential election. Then, 62 percent said they were very enthusiastic about voting.
Voter enthusiasm is down among older and younger voters, as well as white voters and black voters.
Just over half of each candidate’s supporters say they strongly favor him or her. About one in four have reservations, and a similar percentage says theirs is a vote against the other candidate.
Demographics
The demographic contours of the race have not changed much. The gender gap remains notable this year: by large margins men support Trump and women support Clinton. In fact, Trump’s support among men has increased in this poll after dropping in mid-October, amid allegations that he made unwanted sexual advances towards women. His support among men, and white men, is now similar to what it was in early October.
Trump leads among white voters, including white men and whites without a college degree. Clinton has the support of white college graduates, and women regardless of educational attainment. Those living in households with a union member also back Clinton by a large margin.
This poll was conducted by telephone October 28-November 1, 2016 among a random sample of 1,561 adults nationwide, including 1,333 registered voters. Data collection was conducted on behalf of CBS News and The New York Times by SSRS of Media, PA. Phone numbers were dialed from samples of both standard land-line and cell phones.
The poll employed a random digit dial methodology. For the landline sample, a respondent was randomly selected from all adults in the household. For the cell sample, interviews were conducted with the person who answered the phone.
Interviews were conducted in English and Spanish using live interviewers. The data have been weighted to reflect U.S. Census figures on demographic variables.
The error due to sampling for results based on the entire sample and the sample of registered voters could be plus or minus three percentage points. The error for subgroups may be higher and is available by request. The margin of error includes the effects of standard weighting procedures which enlarge sampling error slightly.
The sample of likely voters is modeled among registered voters (N=1,333), assigning each respondent a probability of voting based on their responses. The margin of error for the sample of likely voters is plus or minus three points. This poll release conforms to the Standards of Disclosure of the National Council on Public Polls.


