Another tech bubble in the making? Many signs say yes
Stocks limped across the finish line before the Memorial Day break, with technology stocks pushing the major indexes to new highs. The S&P 500 gained just 0.03 percent on Friday but it was enough to mark the seventh consecutive rise for the leading U.S. stock market benchmark.
That pretty much sums up the market dynamic of late: Small, consistent gains driven by a mere handful of mega-cap tech stocks. You know the names: Facebook (FB), Apple (AAPL), Amazon (AMZN), Netflix (NFLX), and Google parent company Alphabet (GOOG), collectively known as the "FAANGs."
The focus has become so intense it's sucking the oxygen out of the rest of the market, causing investors to ignore some serious macroeconomic headwinds, and bringing back echoes of the late 1990s.
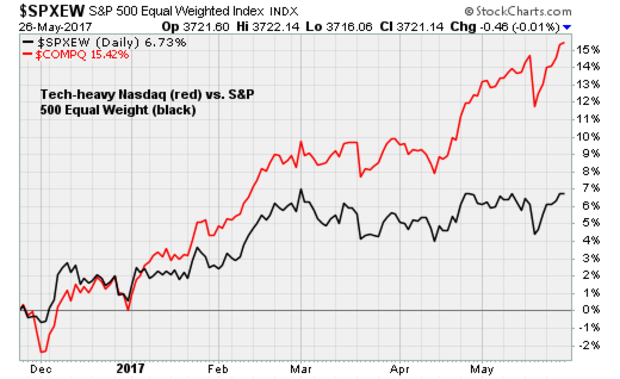
Consider, for instance, that while the major averages led by the Nasdaq Composite are pushing to new highs, broader measures such as the equal-weighted S&P 500 (which is less influenced by the FAANGs) have lagged, as shown in the chart of six-month price performance shown below. That's not normal.
Nor is the narrowing focus on big-tech winners. Consider that just 68 percent of S&P 500 stocks are in uptrends right now vs. 80 percent back in March. Nor that tech insiders are aggressively selling their own shares. Nor that just five tech stocks have been responsible for 40 percent of the S&P 500's market capitalization gains so far this year.
The scale of the tech surge is just breathtaking. Investor inflows into tech stocks is at a 15-year high. The market cap of many tech giants is greater than the economic output of many large cities, according to Bank of America Merrill Lynch, with Alphabet bigger than the GDP of Chicago and Amazon bigger than the GDP of Washington, D.C. And at $1.45 trillion, the combined market cap of Alphabet and Apple is larger than the combined market cap of all Eurozone and Japanese banks.
We've exceeded a high of the dot-com bubble by one measure: U.S. growth stocks (as measured by the MSCI U.S. Growth Index) have outperformed global value stocks (the MSCI World Value Index) by the highest ratio since 2000. Moreover, Bank of America Merrill Lynch notes that the ratio of global stock market capitalization vs. global GDP is on track to exceed the all-time highs set in 1999 and 2007.
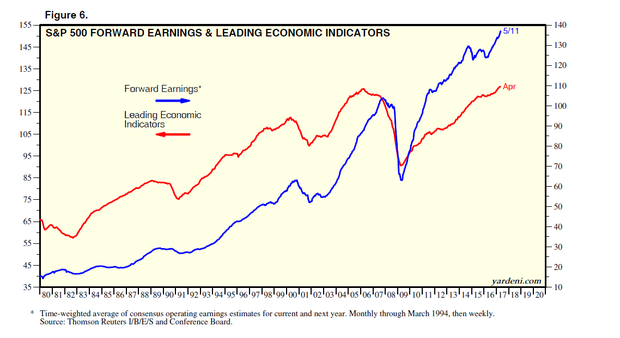
To be fair, some of this confidence is justified. Earnings growth has been solid and leading economic indicators are perking up, as shown above in the chart from Yardeni Research. The hope/hype cycle remains strong for new products like Apple's iPhone 8 and the Tesla's (TSLA) Model 3 and AMZN's drones. And, frankly, other areas of the market are boring for many investors, considering the carnage underway in brick-and-mortar retail to fresh problems for the energy sector.
But has the tech focus and the frothy sentiment that comes with it gone too far?
Both the "smart money" and "dumb money" sentiment measures maintained by Jason Goepfert at SentimenTrader are high -- a "highly atypical" event "especially for a market at its highs," in his words. Historically, such behavior has resulted in choppy trading with a downside bias.
Amid this high sentiment, market breadth continues to narrow as buyers focus more and more of their attention on a shrinking group of rising stocks. Last Thursday, 18 percent of the stocks in the S&P 500 hit a new 52-week high, yet 2.4 percent also hit a new low, which is a sky-high number of new lows on a day when so many stocks are reaching new heights. Goepfert notes this has happened at these rates only two other times since 1990, both leading to market losses.